Population Comparison: São Paulo VS. Rio de Janeiro

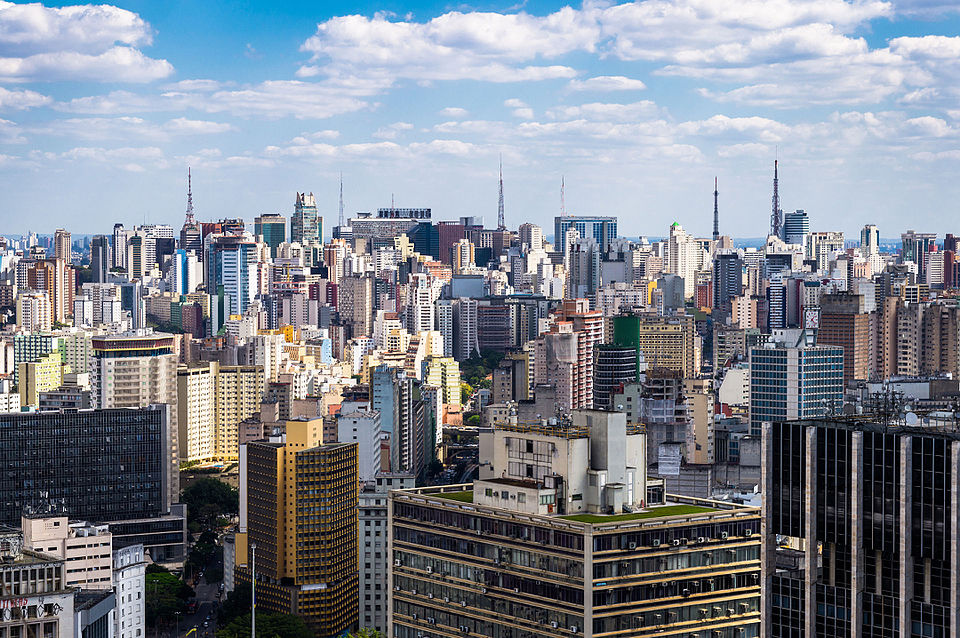
São Paulo and Rio de Janeiro are the two most populous cities of Brazil. Their expansion is really interesting for take note and put in a chart. Since 1940, big changes occurred with both cities. When the changing of capitals from Rio to Brasília started in 1960, Rio saw São Paulo, start a big and vertiginous expansion, which made it a megalopolis, with actually the double of population. Let’s see their population through the years?
Loading Chart
19 Comments
+3
Level 55
Jul 5, 2021
1950 Sao Paulo

WHEEEEEEEEEEEEE!

Rio:

Bruh wtf

+1
Level 43
Jul 5, 2021
This comment says everything.

Everything.

+1
Level 39
Jul 8, 2021
Lmao
+1
Level 43
Jul 8, 2021
Lol
+1
Level 40
Jul 10, 2021
SAO PAULO!
+1
Level 43
Jul 10, 2021
Não, a Tonga da Mironga do Cabuletê 😅🤣
+1
Level 40
Jul 10, 2021
Como ousa😡😡😡😡
+1
Level 43
Jul 10, 2021
Vocês sabe que isso foi uma piada. Eu gosto de SP, mas prefiro BH muito mais.
+1
Level 40
Jul 10, 2021
Eu tambem to brincando kkk
+1
Level 43
Jul 11, 2021
Kk
+1
Level 40
Jul 10, 2021
pra quem vc torce, rio ou sp?????
+1
Level 43
Jul 10, 2021
Não torço pra povo que se acha ;-;
+1
Level 40
Jul 10, 2021
Mas vc também se acha 😁 Só fica falando de Belo Horizonte o dia inteiro, até no seu interview "baptistegorce: IAB..."
+1
Level 43
Jul 10, 2021
Que que eu te fiz...?
+1
Level 40
Jul 10, 2021
To brincando poxa;-;
+1
Level 40
Jul 10, 2021
:(
+1
Level 43
Jul 11, 2021
Eu sei... kkkkk
+1
Level 52
Aug 2, 2021
Interesting. I've recently been attempting to get into charts, I've got some ideas. With apologies for bothering you, I have a question. On the design grid, the numbers I type show up with a comma ... e.g. if I want it to be 1900 it shows up as 1,900.0. Any idea how to fix this?
+2
Level 43
Aug 3, 2021
Thanks! And no way! You're not bothering me! For fix it, go to Design Grid, choose the Axis (Y/X) you want to do this, and at number format, write #.#

You can read more on the Google instructions they are giving.