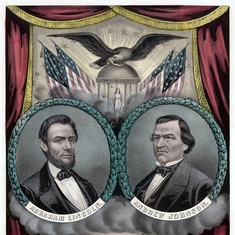
A visualization of United States presidential elections since 1864.
Closely-related parties (such as the Republican and National Union parties) are grouped together
| Year | Republican | Third Party | Democrat |
| 1864 | 55 | 0 | 45 |
| 1868 | 52.7 | 0 | 47.3 |
| 1872 | 55.6 | 0.6 | 43.8 |
| 1876 | 47.9 | 1.2 | 50.9 |
| 1880 | 48.32 | 3.47 | 48.21 |
| 1884 | 48.3 | 2.9 | 48.8 |
| 1888 | 47.8 | 3.6 | 48.6 |
| 1892 | 43 | 11 | 46 |
| 1896 | 51 | 2.3 | 46.7 |
| 1900 | 51.6 | 2.9 | 45.5 |
| 1904 | 56.4 | 6 | 37.6 |
| 1908 | 51.6 | 5.3 | 43.1 |
| 1912 | 23.2 | 35 | 41.8 |
| 1916 | 49.2 | 4.7 | 46.1 |
| 1920 | 60.4 | 5.5 | 34.1 |
| 1924 | 54 | 17.2 | 28.8 |
| 1928 | 58.2 | 1 | 40.8 |
| 1932 | 39.6 | 3 | 57.4 |
| 1936 | 36.5 | 2.7 | 60.8 |
| 1940 | 44.8 | 0.5 | 54.7 |
| 1944 | 45.9 | 0.7 | 53.4 |
| 1948 | 45.1 | 5.3 | 49.6 |
| 1952 | 55.2 | 0.5 | 44.3 |
| 1956 | 57.4 | 0.6 | 42 |
| 1960 | 49.55 | 0.73 | 49.72 |
| 1964 | 38.5 | 0.4 | 61.1 |
| 1968 | 43.4 | 13.9 | 42.7 |
| 1972 | 60.7 | 1.8 | 37.5 |
| 1976 | 48 | 1.9 | 50.1 |
| 1980 | 50.8 | 8.2 | 41 |
| 1984 | 58.8 | 0.6 | 40.6 |
| 1988 | 53.4 | 0.9 | 45.7 |
| 1992 | 37.5 | 19.5 | 43 |
| 1996 | 40.7 | 10.1 | 49.2 |
| 2000 | 47.9 | 3.7 | 48.4 |
| 2004 | 50.7 | 1 | 48.3 |
| 2008 | 45.7 | 1.4 | 52.9 |
| 2012 | 47.2 | 1.7 | 51.1 |
| 2016 | 46.1 | 5.7 | 48.2 |
| 2020 | 46.8 | 1.9 | 51.3 |


I've made one for India too! I've credited you as an inspiration.