How to Make SVG Maps
Last updated: Saturday July 13th, 2019
Some users have asked how to make SVG maps like the ones we have in our quizzes here and here.
It's a somewhat complicated process that took me a long time to learn. I hope that this article will save time for people who are trying to make maps of their own. Warning: This article assumes expert level computer skills.
The first step in the process is getting the raw data we need. To make an SVG map, we will need either a "shape file" or a "geojson" file.
To get a shape file that contains all the countries, go to Natural Earth, then click "Download Countries".
You can also download a shape file with all regions of all countries under the heading "Admin 1 – States, Provinces".
In addition, many government entities offer these types of files as well. For example, the U.S. Census Bureau has a shape file for the counties of every state in the United States. If you need a specific file, try searching Google for "shape file" or "geojson file".
Note: You may have noticed that some of these files are very large and unwieldy! We will deal with this in the next step.
The next step in the process involves taking a huge shape file or geojson file and making it into a geoson file of a useable size.
For that, we are going to use an awesome command line tool called MapShaper. You will need to install this program, including the prerequisite: Node.js.
Got that installed? Good! Let's practice making the geojson file that I used to make our Regions of France Quiz.
Download the shape file with all the regions of every country, found here. Once you've download it, unzip it. It will contain a directory with many files. Even though only one of these is a shape file (.shp), some of the other files are necessary so don't delete them.
Now, run this command:
mapshaper -i ne_10m_admin_1_states_provinces/ne_10m_admin_1_states_provinces.shp snap -simplify visvalingam 5% -o format=geojson force admin1.geojsonThis command is doing several things. Let's break it down part by part.
- -i ne_10m_admin_1_states_provinces/ne_10m_admin_1_states_provinces.shp
This indicates the shape file we are using as an input.
- snap
This is necessary to fix errors in our geojson file. The source data has a problem where borders from neighboring regions don't align exactly. Running mapshaper with this keyword will fix these errors. Before I found mapshaper, dealing with these errors was extremely frustrating!
- -simplify visvalingam 5%
This "simplifies" our geojson, which results in a smaller geojson file with less detail. Without simplification, our output file would be 574 MB! You can vary the % to make the file smaller or larger depending on your needs. The lower the %, the smaller the file.
- -o format=geojson force admin1.geojson
Finally, this indicates that the output file will use the geojson format. The output file is admin1.geojson. The keyword "force" indicates that the output file will be overwritten if it already exists.
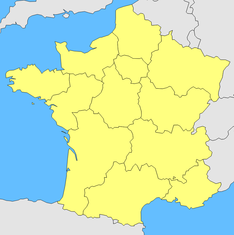
Our file still contains every country of the world. Let's slice it to get just the country we want (in this case, France):
We also want the neighboring countries on our map. Let's put them into a separate file.
These neighboring countries are still broken up into their regions. Let's merge these regions together:
At the end of this process, we have two .geojson files that we will use. One file, france.geojson, contains the regions of France. The second file, surrounding-countries.geojson, contains the countries that are near France.
If you are curious, I'd recommend opening these files in a text editor. Geojson is a human-readable format.
Now that we have geojson files we need to turn them into an SVG file that we can manipulate with a vector editing program like Inkscape.
To do this, we will use javascript.
Download and extract this zip file. It contains the two geojson files created in Step 3. It also contains a file named d3.js and another file named svgify.html
Open svgify.html in Firefox. Opening it in Chrome will not work due to cross-site scripting restrictions. However, you will be able to open it on Chrome if you access it through a local webserver.
In the browser, you should see the map of France and its neighboring countries. This might look pretty bad, but it will look sharp when you enlarge it in a vector graphics editor and edit the css: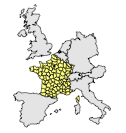
Now, in the browser, right click the map and choose "Inspect Element". You should see the SVG code. Copy the SVG code and paste it into a text editor. Save the file as "france.svg". You now have an SVG file that you can edit with a vector editing program like Inkscape.
How does this work? The d3.js file is doing most of the heavy lifting. D3 stands for "Data-Driven Documents". Books have been written about D3, and I'm not an expert on how it works. I know just enough to make these maps.
If you open svgify.html in a text editor you will the code that tells d3 how to draw the map. You can edit this code to use different geojson input files or different map projections. In this case, we are using the Mercator projection. There's a lot you can do with d3, but it's beyond the scope of this article.
I realize this article is pretty technical. There's a lot I left out for the sake of brevity. If you have questions, please post them in the comments!
Cool.
Cool.
Cool.
If anyone wants to grab my 23 wards of Tokyo quiz and attach a map to it they are very welcome to!
I'm wanting to create a map for my 23 wards of Tokyo quiz. Is it easy to use what is already out there and modify it? For example Wikipedia uses the following map?
https://en.m.wikipedia.org/wiki/File:Tokyo_23_Special_Wards_Area_Map.svg
It doesn't work with Winzip either.
i need map. 53 quizzes . MAPLESS